Summary
I stumbled upon a paper in a recent issue of PNAS where the authors provided evidence for three startling claims. The title of the paper “Inequality in nature and society” caught my attention and the arguments presented were both challenging and novel.
In summary, they suggest that the patterns of inequality in nature (i.e. the dominance of abundances of a single species in an ecosystem) and inequality in society (select billionaires aggregating the majority of global wealth) are similar1. For example comparisons using the Gini Index of the wealth in countries and in natural communities are nearly identical.
The paper goes on to suggest that the mechanisms present in nature and society to counteract this hyper-dominance are fundamentally the same (i.e. predation/“natural enemies” and wealth-redistribution respectively).
What was then argued and supported by modelling and simulation ran straight against conventional thought. The authors suggested and went on to show that:
inequality in both systems can arise from chance alone.
So-called “null-models” in ecology are well known, but this claim challenges the commonly accepted notion that “entrepreneurial advantage”, competitiveness and work-ethic explain the wealth gap.
Simulations
I checked the supplementary materials to see how these models were built and rejoiced to see that basic equations and scenarios could be used to investigate this behaviour.
The authors used several complementary approaches (minimal models, multi-actor models, and agent based models) to explore how inequality arises.
In this post I will demonstrate the first of the three agent-based models;
- Dice Game
- Kinetic Exchange
- Adapted Exchange
In this simulation the following scenario in constructed;
- 1000 agents are generated
- each agent is given an equal wealth ($100)
- in every round (iteration) each agent rolls a dice - the value of the dice determines their fractional gains or losses in the following manner:
| Dice Number | Fractional Factor |
|---|---|
| 1 | -0.8 |
| 2 | -0.4 |
| 3 | -0.2 |
| 4 | 0.2 |
| 5 | 0.4 |
| 6 | 0.8 |
- each agent takes it proportional gain or loss:
\[W_i(t+1) = (1+D_i) \times W_i(t)\] - the overall amount of money is maintained constant by redistributing overall gain or loss over all agents proportionally to their wealth:
\[W(t+1) = W_i(t) + \frac{T- \sum{}{}{W_i(t)}}T \times W_i(t)\]
Implementation
To get a basic working implementation 2 one needs:
- vector of starting values
- a function which computes the “dice-rolls”
- an iterator (to apply the function to every row - i.e. an
applyfunction) - an empty matrix to be filled with the results of each step
- this procedure wrapped in an outer “step function”.
In this case I iterate N steps/cycles with a simple for loop structure.
Let’s firstly set some global parameters.
  # define parameters
  players <- 10
  interactions<-250

  # make intial distribution
  dat <- matrix(rep(interactions,players),nrow = players)

  # assign dice "multipliers"
  dice <-c(-0.8,-0.4,-0.2,0.2,0.4,0.8)
The game-function uses sample to draw numbers from the dice and assign new wealth to each player. The per-round wealth is adjusted based on the difference between the total initial and new wealth.
# define game function
  diceGame <- function(x) {

    beg <- sum(x) # total in beginning
    int <- x*(1+sample(dice,players,replace = TRUE)) # draw outcomes
    newTot <- sum(int) # sum of new balance

    fac <- (newTot-beg)/newTot # calculate factor
    duty <- int-(fac*int) # apply to keep total wealth constant

    return(duty) # return new distribution to players
  }
A empty matrix is prepared to hold the results, and then one steps through the desired simulation. The apply function is used to compute for every row (MARGIN = 2) in our dataset of wealth. The initial data is progressively updated for each step.
  # create holder of results
  holder <- matrix(ncol=interactions,nrow=players)

  # iterate through main loop
  i=1
  for (i in i:ncol(holder)) {

    results<-apply(dat, MARGIN = 2,FUN = diceGame) # iterate draws down columns

    holder[,i] <-results # pass results to holder

    dat<-results # reassign latest outcome to balance sheet

  }
Using the matplot function one can plot the entire array together to trace wealth development, or alternatively transform the data into a dataframe for plotting with ggplot2 (shown below).
matplot(t(holder),type = "l",
        main="Inequality Arising from Pure Chance (Dice Analogy)",
        xlab = "Interactions (n)",
        ylab="Wealth",lty = 1,lwd = 0.5)
library(reshape2)
library(ggplot2)
data <- melt(holder,id="x")
ggplot(data,aes_string(x="Var2",y="value",colour="Var1",group="Var1")) + geom_line(aes(colour=as.factor(Var1)),size=0.5) +
facet_wrap(~Var1) +
xlab("Iterations (n)") +
ylab("Total Wealth") +
labs(title="10 Individual Trajectories Of Players in a Wealth Exchange Game") +
theme_plain() +
guides(colour=FALSE) 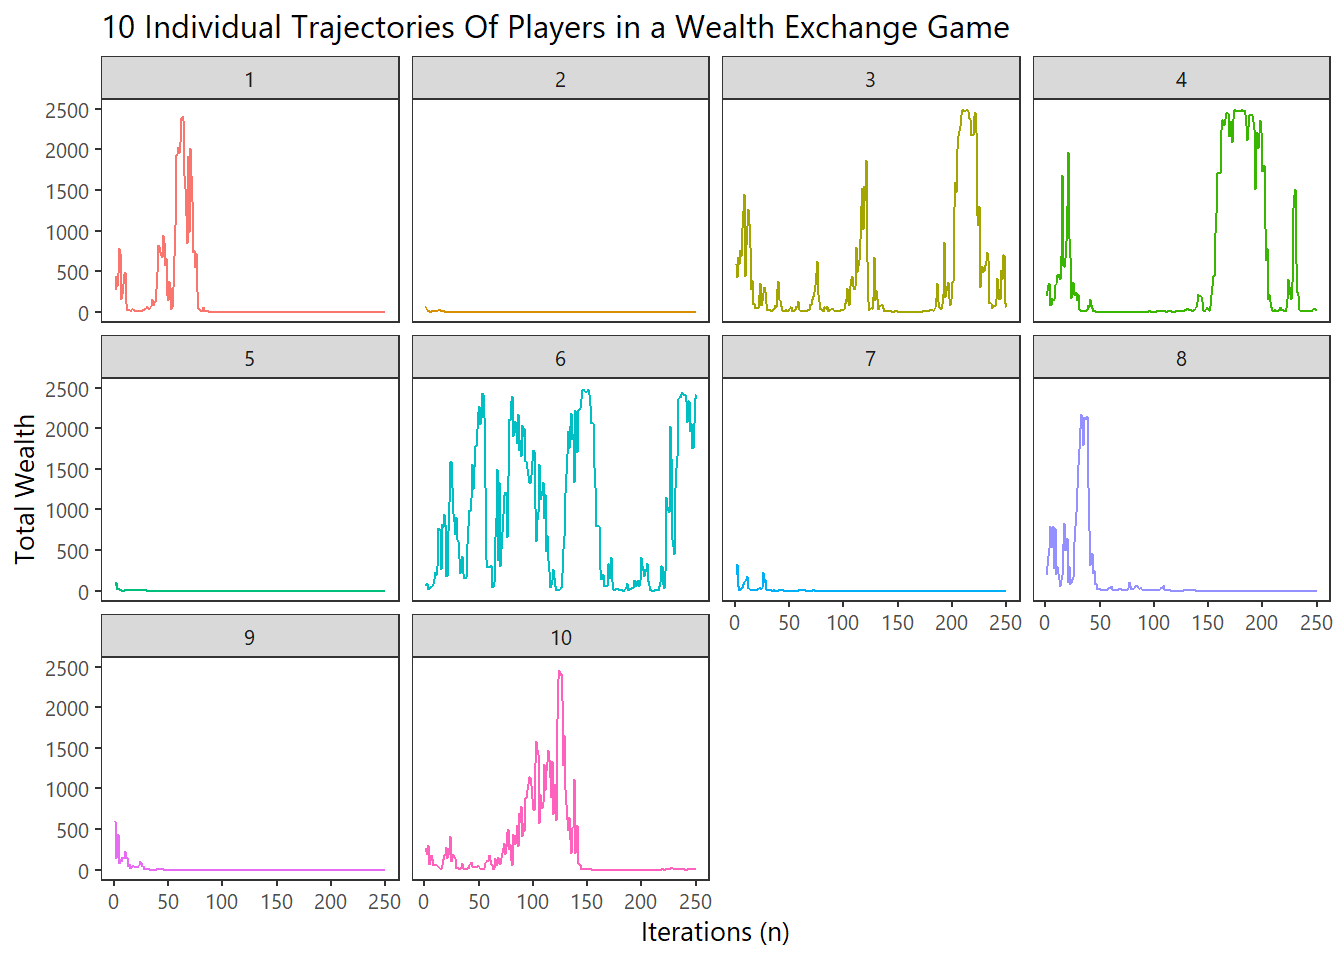
The data from natural systems included fish and crustaceans, trees, flies, rodents, ants, mushrooms, seedlings, human gut bacteria, and phytoplankton.↩
The authors offer a variation with a wealth redistribution scheme where each player pays taxes (a fixed proportion of their wealth) after a specified period and the sum of these contributions is equally divided between all players. This readdresses the growing wealth gap and stabilises the Gini Index.↩