Summary
One of the most talked about natural science papers of the last year - More than 75 percent decline over 27 years in total flying insect biomass in protected areas described the precipitous decline of insect biomass across Germany over the last 3 decades.
The researchers deployed trap stations over short periods (days-weeks) across a diverse range of sites and settings to capture and quantify the abundance of flying insects .
The paper used R for statistical computation, modelling and constrution of some of the main figures. The data (and paper itself) were openly available and I attempted to loosely replicate one of the main figures.
Implementation
Using maggritr and dplyr for data manipulation.
# compute an experimental time window period for each trap
captures <- s004 %>% mutate(expPeriod = to.daynr-from.daynr,
                            avgAcc=round((biomass/expPeriod),2))

# overview of data
captures %>%
  datatable(., rownames = FALSE, filter="top",
            options = list(pageLength = 5, scrollX=T)) %>%
  DT::formatStyle(columns = c(1:14), fontSize = '85%')
# group into locales
locales <- captures %>%
group_by(location.type)For plotting ggplot2 is the easiest way to build up a comprehensive figure.
# replicate the main plot
ggplot(captures,aes(mean.daynr,avgAcc,color=year,size=expPeriod)) +
  geom_point() +
  scale_size_area(max_size = 8,breaks=c(5,15,30,45)) +
  scale_color_gradient(low="blue",high="red") +
  xlab("Day of Year") +
  ylab("Average Biomass Accumulation (g/D)") +
  labs(title="Decline in flying insect biomass at 69 Stations in Germany over the period 1989-2016",
       size="Trap Exposure Time") +
  guides(color=guide_colourbar(title="Year")) +
  coord_trans(y="log") +
  scale_y_continuous(expand = c(0,0.5),breaks=c(0.5,5,25,40)) +
  scale_x_continuous(expand=c(0.1,0.1),breaks=c(90,150,210,270,330)) +
theme_plain(base_size = 9) 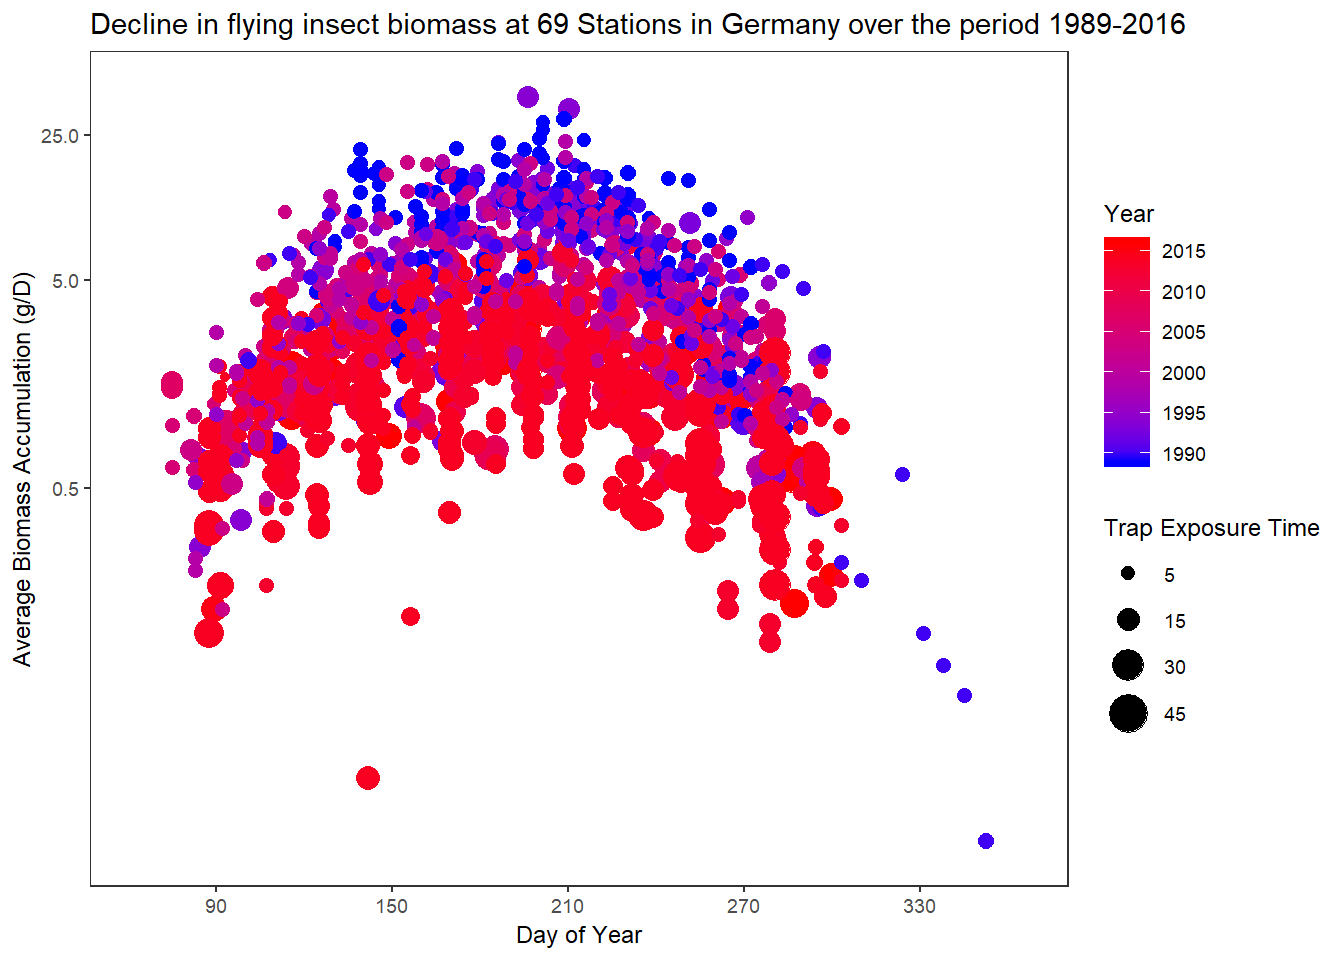
sessionInfo()## R version 3.5.2 (2018-12-20)
## Platform: x86_64-w64-mingw32/x64 (64-bit)
## Running under: Windows 10 x64 (build 17763)
##
## Matrix products: default
##
## locale:
## [1] LC_COLLATE=English_United States.1252
## [2] LC_CTYPE=English_United States.1252
## [3] LC_MONETARY=English_United States.1252
## [4] LC_NUMERIC=C
## [5] LC_TIME=English_United States.1252
##
## attached base packages:
## [1] stats graphics grDevices utils datasets methods base
##
## other attached packages:
## [1] bindrcpp_0.2.2 DT_0.5 forcats_0.3.0 stringr_1.4.0
## [5] dplyr_0.7.8 purrr_0.3.0 readr_1.3.1 tidyr_0.8.2
## [9] tibble_2.0.1 ggplot2_3.1.0 tidyverse_1.2.1
##
## loaded via a namespace (and not attached):
## [1] tidyselect_0.2.5 xfun_0.4 haven_2.0.0 lattice_0.20-38
## [5] colorspace_1.4-0 generics_0.0.2 htmltools_0.3.6 yaml_2.2.0
## [9] rlang_0.3.1 later_0.8.0 pillar_1.3.1 glue_1.3.0
## [13] withr_2.1.2 modelr_0.1.3 readxl_1.2.0 bindr_0.1.1
## [17] plyr_1.8.4 munsell_0.5.0 blogdown_0.10 gtable_0.2.0
## [21] cellranger_1.1.0 rvest_0.3.2 htmlwidgets_1.3 evaluate_0.13
## [25] labeling_0.3 knitr_1.21 httpuv_1.4.5.1 crosstalk_1.0.0
## [29] broom_0.5.1 Rcpp_1.0.0 xtable_1.8-3 promises_1.0.1
## [33] scales_1.0.0 backports_1.1.3 jsonlite_1.6 mime_0.6
## [37] hms_0.4.2 digest_0.6.18 stringi_1.2.4 shiny_1.2.0
## [41] bookdown_0.9 grid_3.5.2 cli_1.0.1 tools_3.5.2
## [45] magrittr_1.5 lazyeval_0.2.1 crayon_1.3.4 pkgconfig_2.0.2
## [49] xml2_1.2.0 lubridate_1.7.4 assertthat_0.2.0 rmarkdown_1.11
## [53] httr_1.4.0 rstudioapi_0.9.0 R6_2.3.0 nlme_3.1-137
## [57] compiler_3.5.2