Summary
As an exercise in skeletal-programming I wanted to evaluate how many times a given set of assorted items needs to be randomly split into two piles, compared against each other and then reassembled removing a given proportion of duplicates at each iteration, until ultimately no duplicate items remain!
Skeletal programming is assembling the bare-minimum programmatic structures needed to test an idea at the level of intuition
I want to use this “wax-rinse-repeat” process in a small project to sort, and categorise a catalogue of tens of thousands of images taken over a decade. The basic idea is to split subsets of the library of images into two directories, apply image-hashing via Python to allocate IDs to each image. A collection of bash tools such as awk, sed are then used to list, collate and remove duplicates in a continuous cycle.
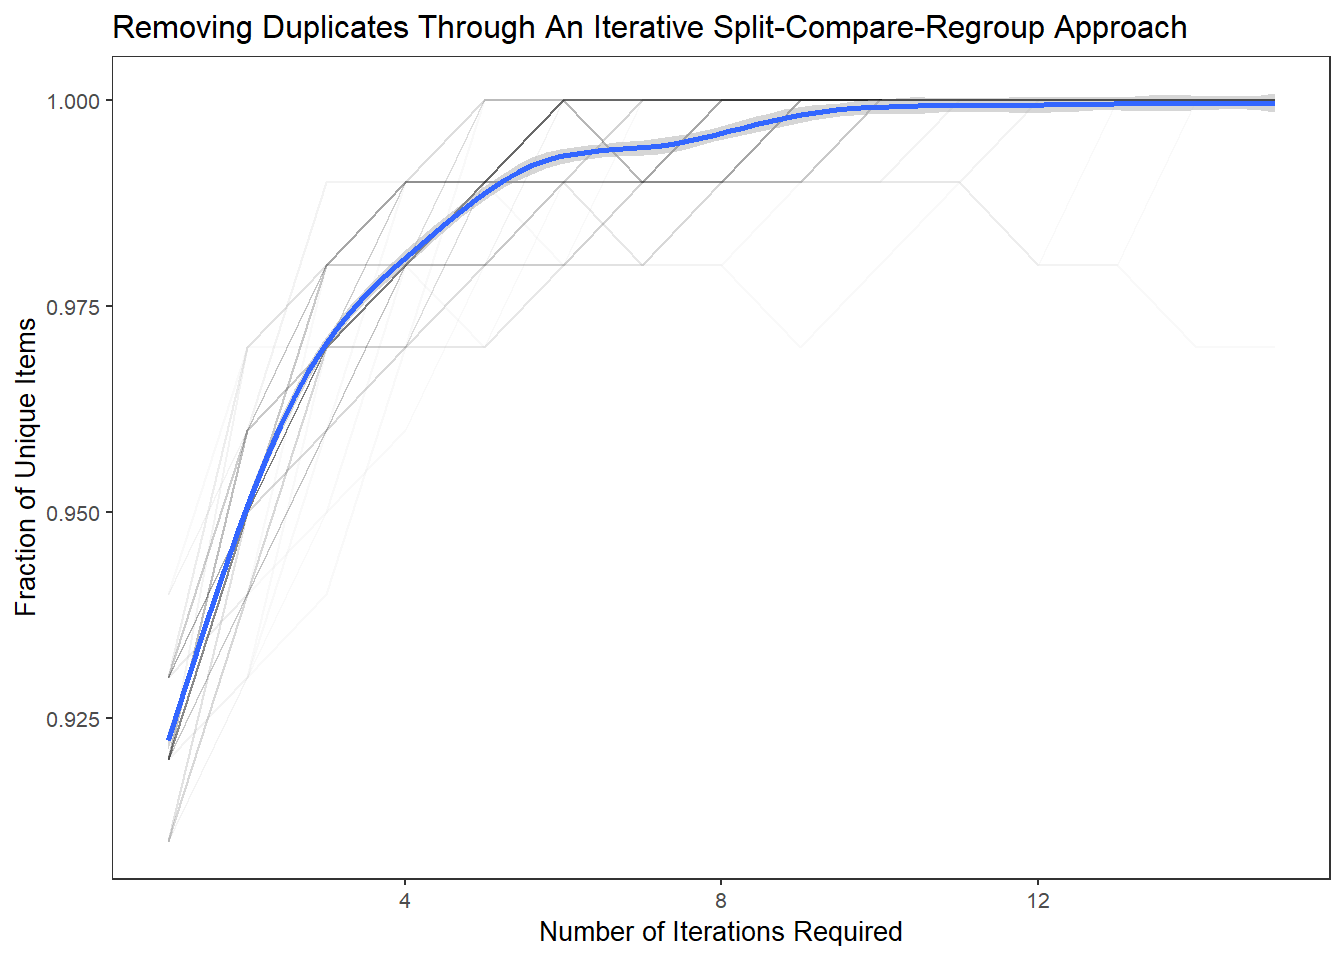
The results from this experimental “card-sorting” exercise suggests that as few as 6-10 splits-repeats are need to reach unity.
Implementation
I use a model function, and a stepper function to power my simulation. Reproducibility and robustness of results is estimated through repetition using the replicate function.
- model function: defines the code to build, split and recombine the items
- stepper function: passes parameters to the model, including the initial size of data, split-sizes, repetitions (passes), replicates etc.
Model Function
# model (compute) function
# splits duplicates into 2 piles

shares <-function(x,sp){

  fracA <-length(x)*sp
  fracB <-length(x)-fracA

  # generate two pools of data to compare
  sideA <-sample(x,fracA,replace=FALSE)
  sideB <-x[-which(sideA %in% x)]

  # check which tiems are in both pools
  leftB <-sideB[-which(sideB %in% sideA)]

  leftAB <-c(sideA,leftB)
  return(leftAB)

}
Stepper Function
# stepper function
# passes all parameters to the model function
# holds a loop function for iteration
# writes diagnostics/results to file

stepper <-function(nsteps=15,pool=500,dups=0.25,splits=0.70){

  # generate initial data-set
  sams <-c(seq(1,pool,1),c(sample(seq(1,pool,1),dups*pool)),c(
                            seq(pool+floor(dups*pool),2*pool-1,1)))

  # prepare holder for the results
  transactions <-matrix(ncol=2,nrow=nsteps)

  # initialise the loop
  for (i in seq_len(nsteps)){

    sams <-shares(sams,sp=splits)
    res <-round(as.numeric(length(unique(sams))/length(sams)),2)
    trn <-res
    transactions[i,2] <-trn
    transactions[i] <-i # update :: keep track of step in loop
  }

  return(transactions)

}
A single run can be returned by running the stepper function with default parameters.
tr <-stepper()
str(tr)
## num [1:15, 1:2] 1 2 3 4 5 6 7 8 9 10 ...Robust Estimation of Event-Space
Using the replicate function one can return hundreds of simulations to gain an estimation of the range of possible outcomes and trajectories.
Its worth noting that the output of the replicate function can be returned in a variety of forms - such as an array, matrix etc. Further processing and reshaping can be added to build an object ready for tidy plotting.
# define number of replicate runs
reps <- 100

# returning an array (the default)
opt.array <-replicate(reps,stepper())

# returning a matrix :: using replicate in combination with do-call/rbind
opt.matrix <-do.call(rbind, replicate(reps, stepper(), simplify=FALSE))

# returning a list :: using lapply in combiantion with do.call/rbind
opt.list <-do.call(rbind, lapply(1:reps, function(i) stepper()))

# returning a dataframe :: convert an array to a data.frame.table without plyr
opt.df <-as.data.frame.table(opt.array)
head(opt.df)
## Var1 Var2 Var3 Freq
## 1 A A A 1
## 2 B A A 2
## 3 C A A 3
## 4 D A A 4
## 5 E A A 5
## 6 F A A 6opt.df %>% datatable(., rownames = TRUE, filter="none",
options = list(pageLength = 10, scrollX=F)) %>%
DT::formatStyle(columns = c(1:4), fontSize = '85%')Tidying and Plotting
I chose to rearrange the returned data.frame into a tidy form. The key-variable pair is: Var2 which contains the iterations of the splits, and Freq which contains and the percentage of unique items remaining.
Var3 contains the alphanumeric count of the simulation runs (1-100). Similarly Var1 contains the step number of the replicate function.
# rearrange the data into a tidy form
df.tidy <-spread(data = opt.df, key = Var2, value = Freq)
head(df.tidy)
## Var1 Var3 A B
## 1 A A 1 0.91
## 2 A B 1 0.93
## 3 A C 1 0.92
## 4 A D 1 0.91
## 5 A E 1 0.91
## 6 A F 1 0.92# preview of tidy data
df.tidy %>% datatable(., rownames = TRUE, filter="none",
options = list(pageLength = 10, scrollX=F)) %>%
DT::formatStyle(columns = c(1:4), fontSize = '85%')# plot simulated runs
ggplot(aes(A,B),data=df.tidy) +
geom_line(aes(group=Var3),alpha=0.025) +
geom_smooth() +
xlab("Number of Iterations Required") +
ylab("Fraction of Unique Items") +
labs(title="Removing Duplicates Through An Iterative Split-Compare-Regroup Approach") +
theme_plain(base_size = 10)