Summary
In order to maintain a fluid ecosystem of data-management, -analysis, and -reporting the modern data engineer should be prepared to ship data across devices, networks and development, and storage environments.
In many instances data needs to be available across both binary and relational realms, whilst still affording availability and querability.
Using R as the glue I export data from PowerBI to a PostgreSQL database. From within RStudio this database-table can be subsequently queried using three distinct syntax approaches.
Implementation
The demo dataset (“Red Wine Quality”) was sourced from Kaggle. It was imported into, and cleaned in Power BI using standard methods.
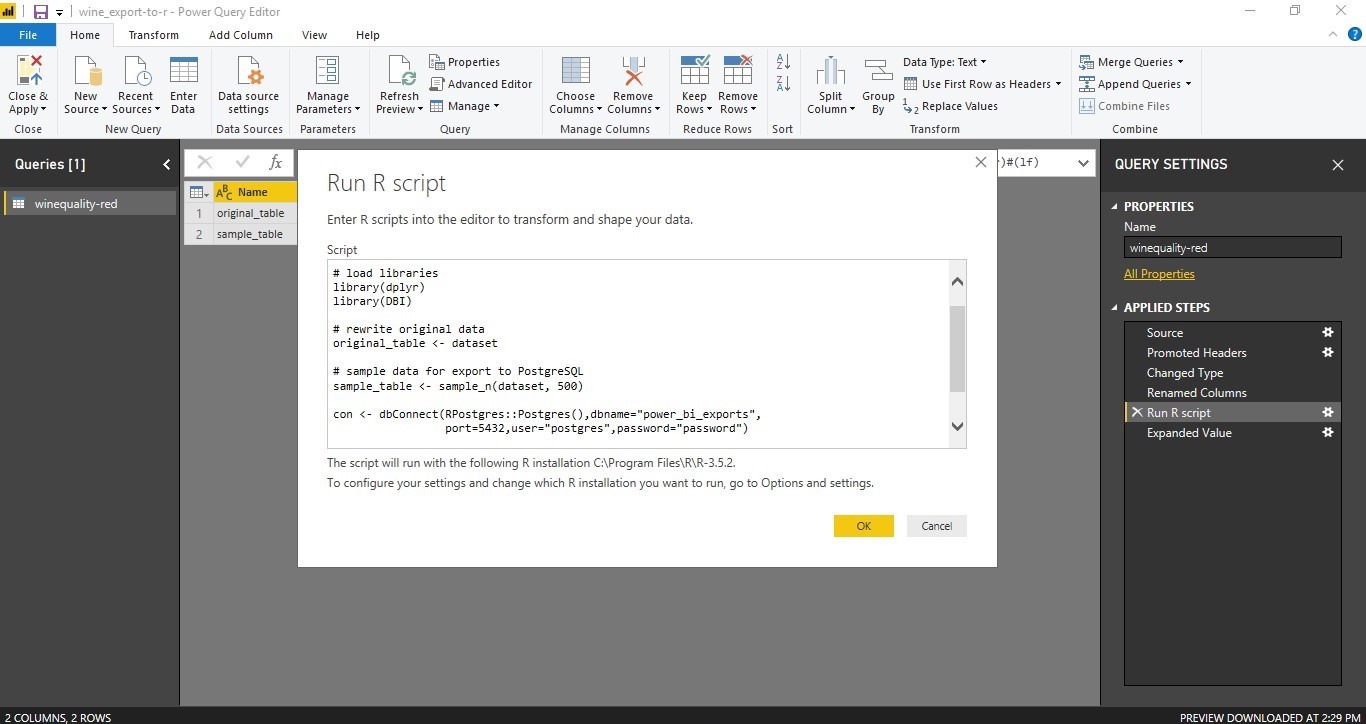
Using the Query Editor tab, and the Transform function one can access the standard R installation on your system and run scripts against the given table.
Two libraries, namely DBI (establishing the DB driver connection) and dplyr (for sampling) are required.
Exporting the Data to PostgreSQL
The R code below is pasted into the “Run R-Script” dialogue.
# load the required libraries
library(dplyr)
library(DBI)

# make a copy of original data
original_table <- dataset

# sample data for export to PostgreSQL
sample_table <- sample_n(dataset, 500)

# estabish connection to selected Postgre database
con <- dbConnect(RPostgres::Postgres(),dbname="db_name",
                 port=5432,user="USER",password="PASSWORD")

dbWriteTable(con, "wines", sample_table,overwrite=TRUE)

dbDisconnect(con)
In the above example the sampled table, sample_table is passed to PostgreSQL, a new table, wines is initiated and populated in the database, db_name.
Querying the PostgreSQL Table from R
Back in RStudio one can establish a connection to the database, and query the data using 3 different syntax approaches.
using a native PostgreSQL syntax
a so-called “pass-by SQL” syntax where regular SQL code is inserted as a string into the query function
or utilizing the power of the dplyr package, and passing regular chained commands which are then interpreted to SQL
# querying using postgreSQL syntax
query_psg <- dbSendQuery(con, "SELECT fixed_acidity,
                   residual_sugar, chlorides
                   FROM wines
                   WHERE quality = 5
                   LIMIT 10;")

dbFetch(query_psg)
## fixed_acidity residual_sugar chlorides
## 1 7.6 2.2 0.071
## 2 6.5 1.8 0.073
## 3 8.1 2.1 0.077
## 4 9.0 2.6 0.089
## 5 6.4 1.8 0.067
## 6 7.8 1.7 0.100
## 7 8.1 1.8 0.157
## 8 7.1 2.2 0.073
## 9 10.0 2.2 0.077
## 10 6.8 2.1 0.070# clear previous query
dbClearResult(query_psg)
# querying using SQL syntax (pass by)
query_sql <- dbGetQuery(con,'
SELECT "alcohol", "quality", AVG("citric_acid") as "avg_citric_acid"
FROM "wines"
WHERE "quality" > 4
GROUP BY "alcohol", "quality"
ORDER BY "quality" DESC
LIMIT 20
')
query_sql## alcohol quality avg_citric_acid
## 1 14.0 8 0.0300000
## 2 10.0 8 0.3300000
## 3 11.3 8 0.3100000
## 4 12.5 8 0.5000000
## 5 13.1 8 0.3400000
## 6 11.7 8 0.5600000
## 7 13.4 8 0.6700000
## 8 12.9 7 0.3800000
## 9 14.0 7 0.0000000
## 10 11.9 7 0.4366667
## 11 11.8 7 0.4250000
## 12 11.7 7 0.2700000
## 13 12.7 7 0.4200000
## 14 12.5 7 0.2100000
## 15 11.1 7 0.5700000
## 16 12.2 7 0.2600000
## 17 11.3 7 0.3200000
## 18 13.4 7 0.5100000
## 19 10.0 7 0.4900000
## 20 11.6 7 0.4900000# querying using dplyr syntax
query_dplyr <- tbl(con,"wines") %>%
select(fixed_acidity,residual_sugar,chlorides,quality) %>%
group_by(quality) %>%
summarise(acidity_mean = avg(fixed_acidity)) %>%
arrange(desc(quality))
query_dplyr## # Source: lazy query [?? x 2]
## # Database: postgres [postgres@localhost:5432/power_bi_exports]
## # Ordered by: desc(quality)
## quality acidity_mean
## <int> <dbl>
## 1 8 8.23
## 2 7 8.84
## 3 6 8.28
## 4 5 8.06
## 5 4 7.74
## 6 3 7.55The flexibility afforded by the use of R is two-fold. Firstly as the engine for the data-export:
Using regular R-code we can customise the data-aggregation/data-preparation steps inbound to the database. An obvious case is using sampling to incrementally export massive databases that reside in Power BI where the traditional export threshold (30,000 rows) is exceeded.
The second clear advantage is the ease at which R (using DBI) enables connection to an array of database types, deploying the appropriate drivers. Subsequent data analysis can profit from the richness of the R coding, visualization and modelling environment.