Preamble
Its been said that data-analytics is 80% perspiration and 20% inspiration - with most of the effort placed on managing, merging, and coercing data into consumable forms.
My recent experiences suggest that small data (fewer than 1000 records) is often more cumbersome to handle in the short-term than any appreciably larger data-source. It’s not surprising when one considers how these data are produced and how they are meant to be consumed.
Small datasets such as those found on Wikis are rapidly deployed, for consumption as a pure tabular visual display. They generally do not follow common data-formatting practices and are highly dynamic (editing/updating by many diverse contributors). Their structure may expand, and the internal content is often not type-specific due to annotations.
Big data in contrast is often highly-engineered; has implicit structure and offers standard methods of interaction via database connections, APIs or analysis services. Whilst some data of this form may require extensive pre-processing/parsing, usually documentation and well-versed methods can be deployed for repeatable and consistent interaction with the sources.
Deliverable
This post documents the bumpy road of web-scraping dynamic sources with Power BI.
Data Source
The coronavirus outbreak in Hubei Province China, is sitting firmly at the top of news and public discussion - after seeing several data-scientists track its progress on Twitter I looked to make a dashboard of my own.
The initial source of data I used was the Wikipedia page “Timeline of the 2019–20 coronavirus outbreak”. After setting up a connection to the principle table and some transformations steps the report seemed ready, yet every day brought broken queries, as the table headers changed, expanded etc.
The lead me to find another source of data hosted by the Johns Hopkins University Center for Systems Science and Engineering. The source table was formatted in a long format with new (daily) observations being added as additional columns.
In the Power BI Advanced Query Editor I could see these columns were passed as an argument to the ‘Web.Contents’ function.
Source = Csv.Document(Web.Contents("https://raw.githubusercontent.com/CSSEGISandData/COVID-19/master/csse_covid_19_data/csse_covid_19_time_series/time_series_19-covid-Confirmed.csv"),
                      [Delimiter=",",
                       Columns=31,
                       Encoding=65001,
                       QuoteStyle=QuoteStyle.None])
In hindsight I could have just removed this argument and proceeded! Instead I choose to use a parameterised query to retrieve a given range of columns of the source table regardless of how big it grew.
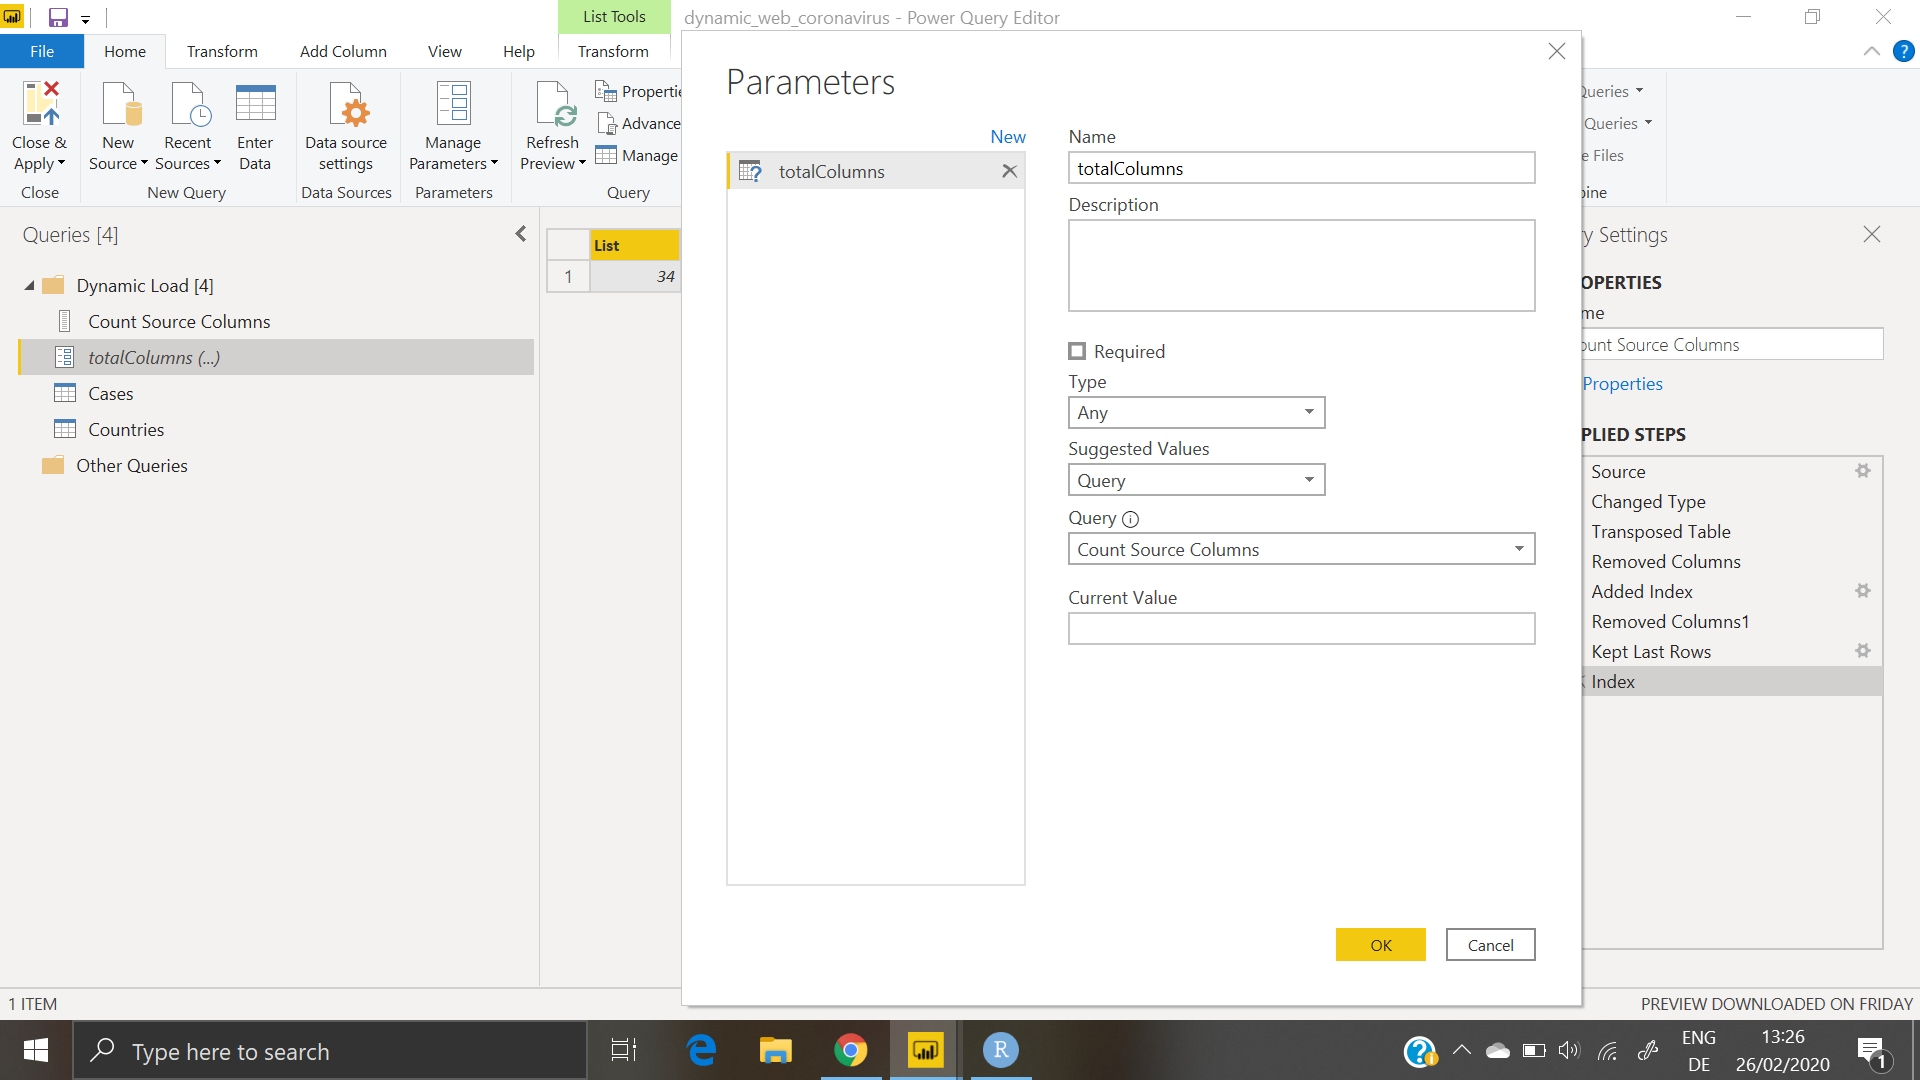
This required a replicate query, with the Columns argument not provided, transposing the table, removing all but a single column, adding an index, removing the final data columns, and keeping the last row (of the index) to give me the total width of the source. Finally the result was converted to a list.
A new parameter TotalColumns is fed the values from the above query, with no default given.

The original query is then derived, and the parameter is passed to the Columns argument.
let
    Source = Csv.Document(Web.Contents("https://raw.githubusercontent.com/CSSEGISandData/COVID-19/master/csse_covid_19_data/csse_covid_19_time_series/time_series_19-covid-Confirmed.csv"),[Delimiter=",", Columns=totalColumns, Encoding=65001, QuoteStyle=QuoteStyle.None]),
    #"Changed Type" = Table.TransformColumnTypes(Source,{{"Column1", type text}, {"Column2", type text}, {"Column3", type text}, {"Column4", type text}, {"Column5", type text}, {"Column6", type text}, {"Column7", type text}, {"Column8", type text}, {"Column9", type text}, {"Column10", type text}, {"Column11", type text}, {"Column12", type text}, {"Column13", type text}, {"Column14", type text}, {"Column15", type text}, {"Column16", type text}, {"Column17", type text}, {"Column18", type text}, {"Column19", type text}, {"Column20", type text}, {"Column21", type text}, {"Column22", type text}, {"Column23", type text}, {"Column24", type text}, {"Column25", type text}, {"Column26", type text}, {"Column27", type text}, {"Column28", type text}, {"Column29", type text}, {"Column30", type text}}),
    #"Promoted Headers" = Table.PromoteHeaders(#"Changed Type", [PromoteAllScalars=true]),
    #"Unpivoted Columns" = Table.UnpivotOtherColumns(#"Promoted Headers", {"Province/State", "Country/Region", "Lat", "Long"}, "Attribute", "Value"),
    #"Changed Type1" = Table.TransformColumnTypes(#"Unpivoted Columns",{{"Value", Int64.Type}}),
    #"Added Custom Column" = Table.AddColumn(#"Changed Type1", "Month", each Text.Combine({Text.End([Attribute], 1), Text.Start([Attribute], 1)}), type text),
    #"Inserted Text Between Delimiters" = Table.AddColumn(#"Added Custom Column", "Day", each Text.BetweenDelimiters([Attribute], "/", "/"), type text),
    #"Inserted Literal" = Table.AddColumn(#"Inserted Text Between Delimiters", "Year", each "2020", type text),
    #"Changed Type2" = Table.TransformColumnTypes(#"Inserted Literal",{{"Month", Int64.Type}, {"Day", Int64.Type}, {"Year", Int64.Type}}),
    #"Inserted Merged Column" = Table.AddColumn(#"Changed Type2", "Date", each Text.Combine({"0", Text.From([Month], "en-GB"), "/", Text.From([Day], "en-GB"), "/", Text.From([Year], "en-GB")}), type text),
    #"Changed Type3" = Table.TransformColumnTypes(#"Inserted Merged Column",{{"Date", type date}})
in
    #"Changed Type3"
Other Functionality
I used a few tips from the GuyInACube channel to build out dynamic titles for visualisations.
Dependent on selected data via slicers, the title dynamically responds from single to multi-select scenarios.
A code example is provided below.
Country Label =
VAR __DISTINCT_VALUES_COUNT = DISTINCTCOUNT('Countries'[Country])
VAR __MAX_VALUES_TO_SHOW = 3
RETURN
    IF(
        __DISTINCT_VALUES_COUNT > __MAX_VALUES_TO_SHOW,
        CONCATENATE(
            CONCATENATEX(
                TOPN(
                    __MAX_VALUES_TO_SHOW,
                    VALUES('Countries'[Country]),
                    'Countries'[Country],
                    ASC
                ),
                'Countries'[Country],
                ", ",
                'Countries'[Country],
                ASC
            ),
            ", etc."
        ),
        CONCATENATEX(
            VALUES('Countries'[Country]),
            'Countries'[Country],
            ", ",
            'Countries'[Country],
            ASC
        )
    )
Video Demonstration
Here is a short video walkthrough of the report.
The static report is provided here