Premable
Financial management and planning can be daunting, and investing in stocks and funds overwhelming. Luckily there is a wealth of information on company financial statements, historical stock prices, and many other metrics.
A semi-automated architecture is used here to assimilate and manage the necessary assets to assess and monitor investment opportunities.
- Companies of interest are captured in a Power App
- Financial data is retrieved via a public API with Power Automate
- A report presenting fundamental analysis using Power BI
Inspiration
This exercise by the philosophies of investment presented by Peter Lynch and more specifically his views expressed in his book “One Up On Wall Street” - including concepts such as the “local-knowledge” and the simple relationship between earnings and stock prices over the long-term.
Solution Architecture
The Power App “Portfolio” is essentially a Trade Republic clone. It allows the user to capture companies of interest, classify (via
Status ReportsandMetrics) and add them to the Dataverse.6 Power Automate flows query the Alpha Vantage API to retrive daily stock prices, historical stock prices, and company-filings (balance sheets)
The Power BI Report “Stocks” presents the core-data
Dataverse Tables
Various custom tables in were built out in Dataverse to hold the relevant data.
- prospect –> holds key company-of-interest data; name, stock symbol, asset class, industry, whether the symbol is callable via the API etc.
- performance –> holds daily stock prices for all assets - these data are then reflected in the Power App
- report –> holds more detailed classification of companies, has a N-1 relationship with prospect
- tsPrices –> holds the historical weekly closing prices, has a N-1 relationship with prospect
- companyfilings –> holds the core historical balance-sheet results of company filings, has a N-1 with prospect
- trade –> currently not utilized, mimics the functional of recording Buy and Sell actions
Details I
The most interesting component of the solution are within the Power Automate flows. Here quite a bit of tuning was needed to deal with the various responses from the API.
Queryiny the TIME-SERIES API returns a nested JSON structure, with the top-level object, holding a further top objects, “Meta”, “Weekly Time Series”. Within the “Weekly Time Series” object a further object nesting is present, holding the weekly prices where each week-object is tagged with its date.
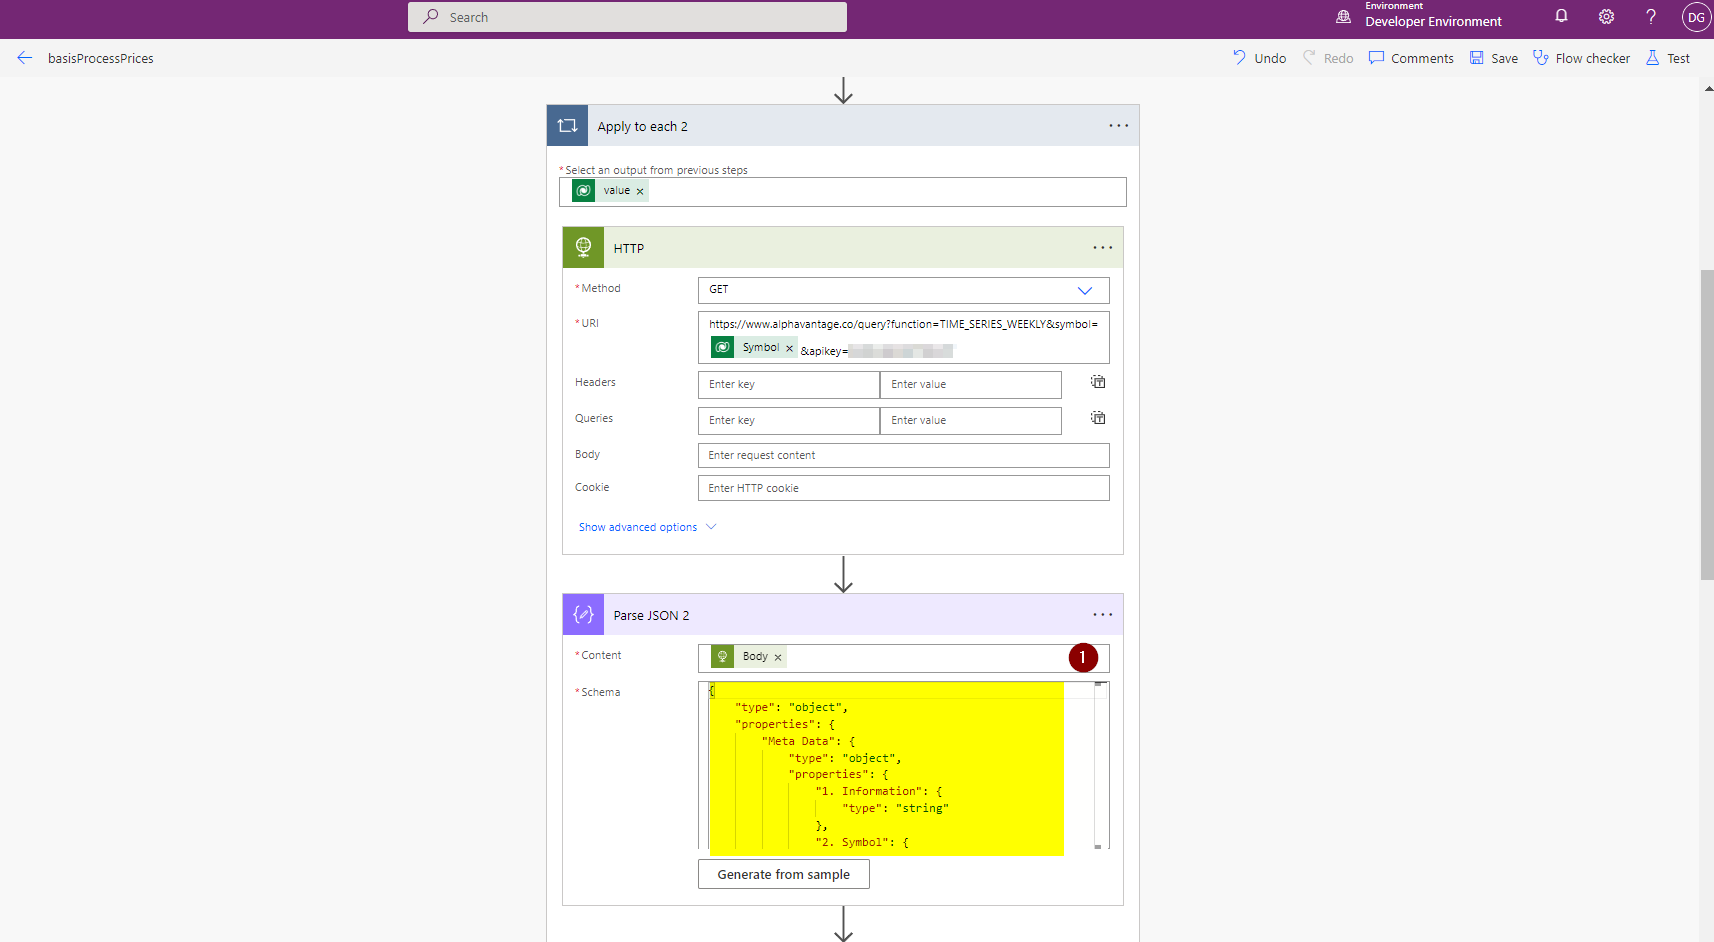
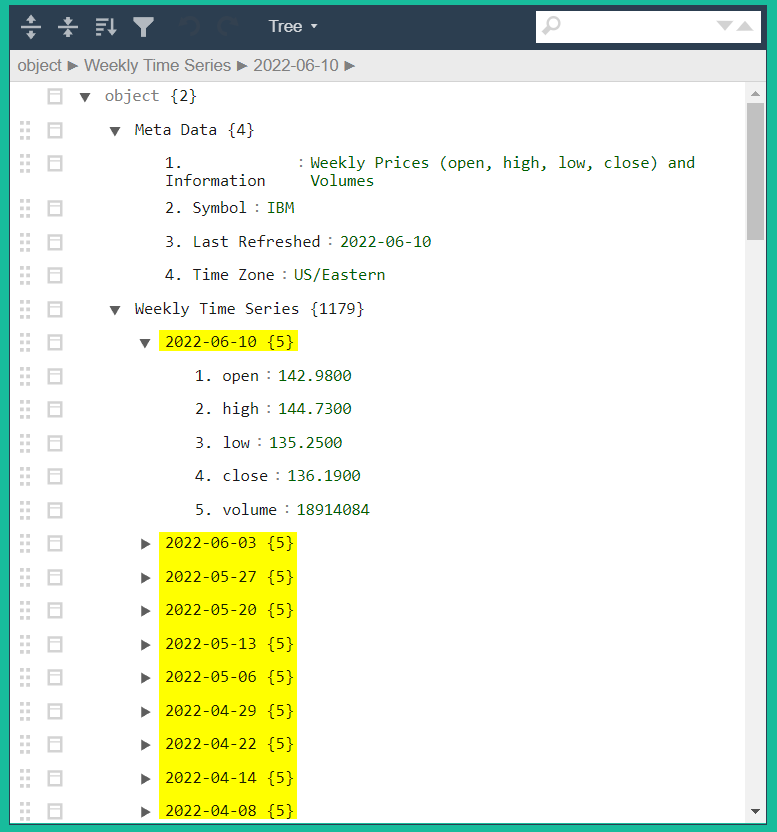
As Power Automates Apply to each action only operates over arrays within object we need to massage this structure into an appropriate format.
Power Automate offers no REPLACE() or SUBSTITUTE() like functions which would allow us to treat the json as a string an replace/substitute characters. Luckily without invocation of any third-party components we can use Excel Online and the scripting functionality it offers.
With Excel scripts we can write short functions using Javascript/Typescript to build the required functionality.
I used two scripts from tachytelic and passed in progressively passed in arguments to replace and match the following regex patterns - ultimately extracting the date “tag” into into own array, and the values into a object of unnamed arrays.
Script Call 1
- regexSubstitute

searchString: `part`[string] (Weekly-Time-Series converetd using asArray)
regexPattern: \"
  replacestring: '
Script Call 2
- regexSubstitute

searchString: `result` of Script Call 1
regexPattern: '(19|20)\d\d[- /.](0[1-9]|1[012])[- /.](0[1-9]|[12][0-9]|3[01])':
  replaceString:
Script Call 3
- regexMatch

searchString: `result` of Script Call 1
regexPattern: (19|20)\d\d[- /.](0[1-9]|1[012])[- /.](0[1-9]|[12][0-9]|3[01])
Script Call 4
- regexSubstitute

searchString: `result` of Script Call 2
regexPattern: \[{{
  replaceString: [{
Script Call 5
- regexSubstitute

searchString: `result` of Script Call 4
regexPattern: \}}]
  replaceString: }]
Running a Parse Json action on the string holding the values returns an array holding the data object.
{
    "type": "array",
    "items": {
        "type": "object",
        "properties": {
            "1. open": {
                "type": "string"
            },
            "2. high": {
                "type": "string"
            },
            "3. low": {
                "type": "string"
            },
            "4. close": {
                "type": "string"
            },
            "5. volume": {
                "type": "string"
            }
        },
        "required": [
            "1. open",
            "2. high",
            "3. low",
            "4. close",
            "5. volume"
        ]
    }
}
And the date tags are captured in an array of strings.
{
    "type": "array",
    "items": {
        "type": "string"
    }
}
Details II
Using a further Apply to each action we can iterate over the values object, whilst passing in the corresponding date-string.
Here I calculated back in time from the first array element in combination with a counter variable. An alternative would be to slice the array to take the element corresponding loop-iterator counter.
formatDateTime(AddDays(formatDateTime(first(body('Parse_JSON_4')),'yyyy-MM-dd'),mul(-7,variables('cnt'))),'yyyy-MM-dd')A new row is inserted in our tsPrice tables for each stock-week pair before the corresponding company is marked as having being checked for historical data.
The flow takes about 2 mins to back-fill the initial historical time-series of 104 weeks.
This flow is scheduled to run every 4 weeks across several slots to accommodate for a maximum of 5 API calls/min against the Alpha Vantage endpoint.
Flow Walkthourgh
Here is a quick video walk-through of the Power Automate flow.