Premable
Here in Part II of the series on “Stock Management with Power Apps, Power Automate and Power BI” I build out a report to assess how groups of stocks have performed. Weekly stock-prices, financial filings, and volume traded are all incorporated.
- the report builds off the Power Automate flows collecting the data streams
- measures and supporting logic are used to group, classify and analyse the fundamentals
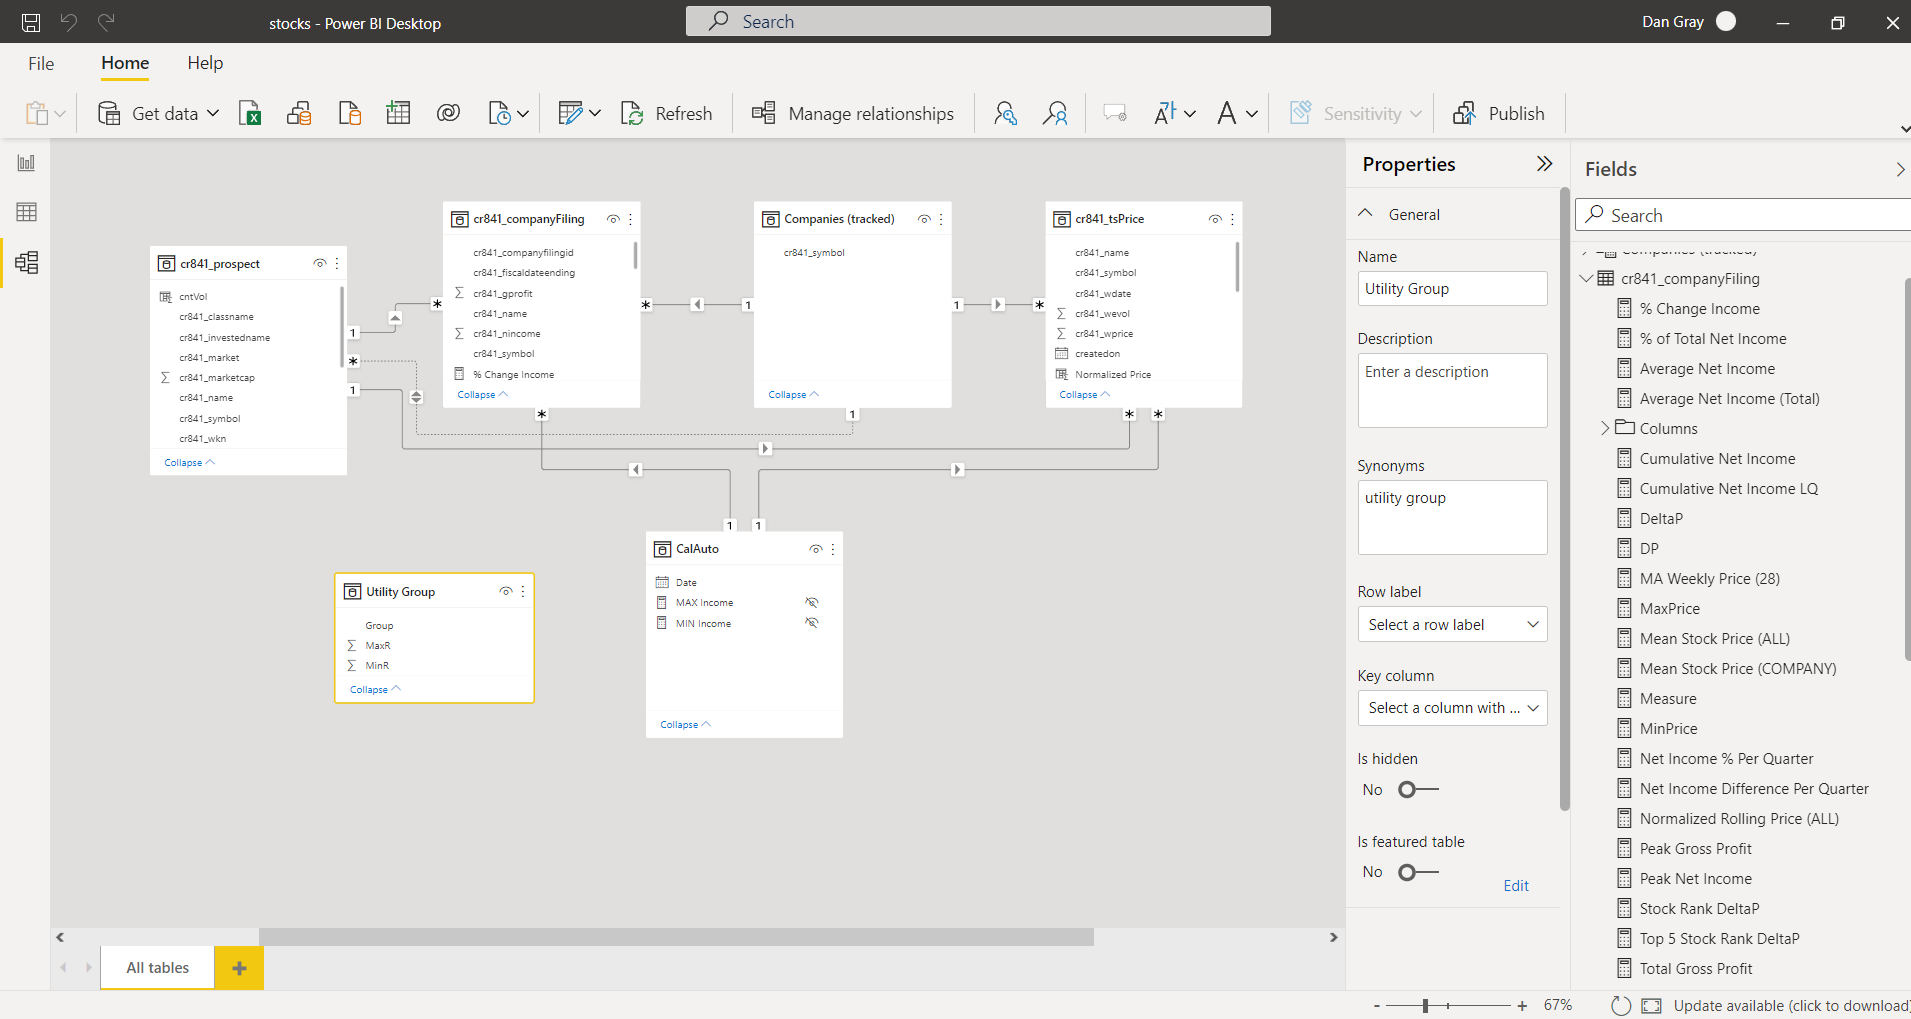
Date Model
The main data is contained in two primary tables tsPrice and companyFiling. These hold the historical weekly prices, and the history of company filings. Centrally I have prospect which holds the core dimensions, and some supporting information such as Market, Invested (yes/no), as well some calculated columns such as History Captured, Lifetime Income, Lifetime Profit, and Utility etc.
Companies (tracked) is a helper table that returns the distinct intersection of companies with both company filing and weekly time-series data and thus relevant for surfacing completely in this report.
Price Evolution / Balance Sheet
The first page attempts to give an overview of temporal evolution of a company’s stock price, as well as present some key metrics.
- Gross Profit, Net Income, Rolling Average Price
- Change in Income (%), and Change Price(%), DeltaP (“Max Price / Min Price”) and others…
# Change in Income
% Change Income =

VAR _maxIn = CALCULATE(
        SUM(cr841_companyFiling[cr841_nincome]),
        FILTER(cr841_companyFiling,cr841_companyFiling[cr841_fiscaldateending]=MAX(cr841_companyFiling[cr841_fiscaldateending])
        )
    )

VAR _minIn = CALCULATE(
        SUM(cr841_companyFiling[cr841_nincome]),
        FILTER(cr841_companyFiling,cr841_companyFiling[cr841_fiscaldateending]=MIN(cr841_companyFiling[cr841_fiscaldateending])
        )
    )

VAR _diff = _maxIn-_minIn

VAR _bothNeg = IF(_maxIn<0 && _minIn <0 && _maxIn < _minIn,
    DIVIDE(_minIn,_maxIn,0)-1,
        IF(_maxIn<0 && _minIn <0 && _maxIn > _minIn,
            DIVIDE(_minIn,_maxIn,0)-1,
                DIVIDE(_diff,ABS(_minIn),0)
        )
)

RETURN
_bothNeg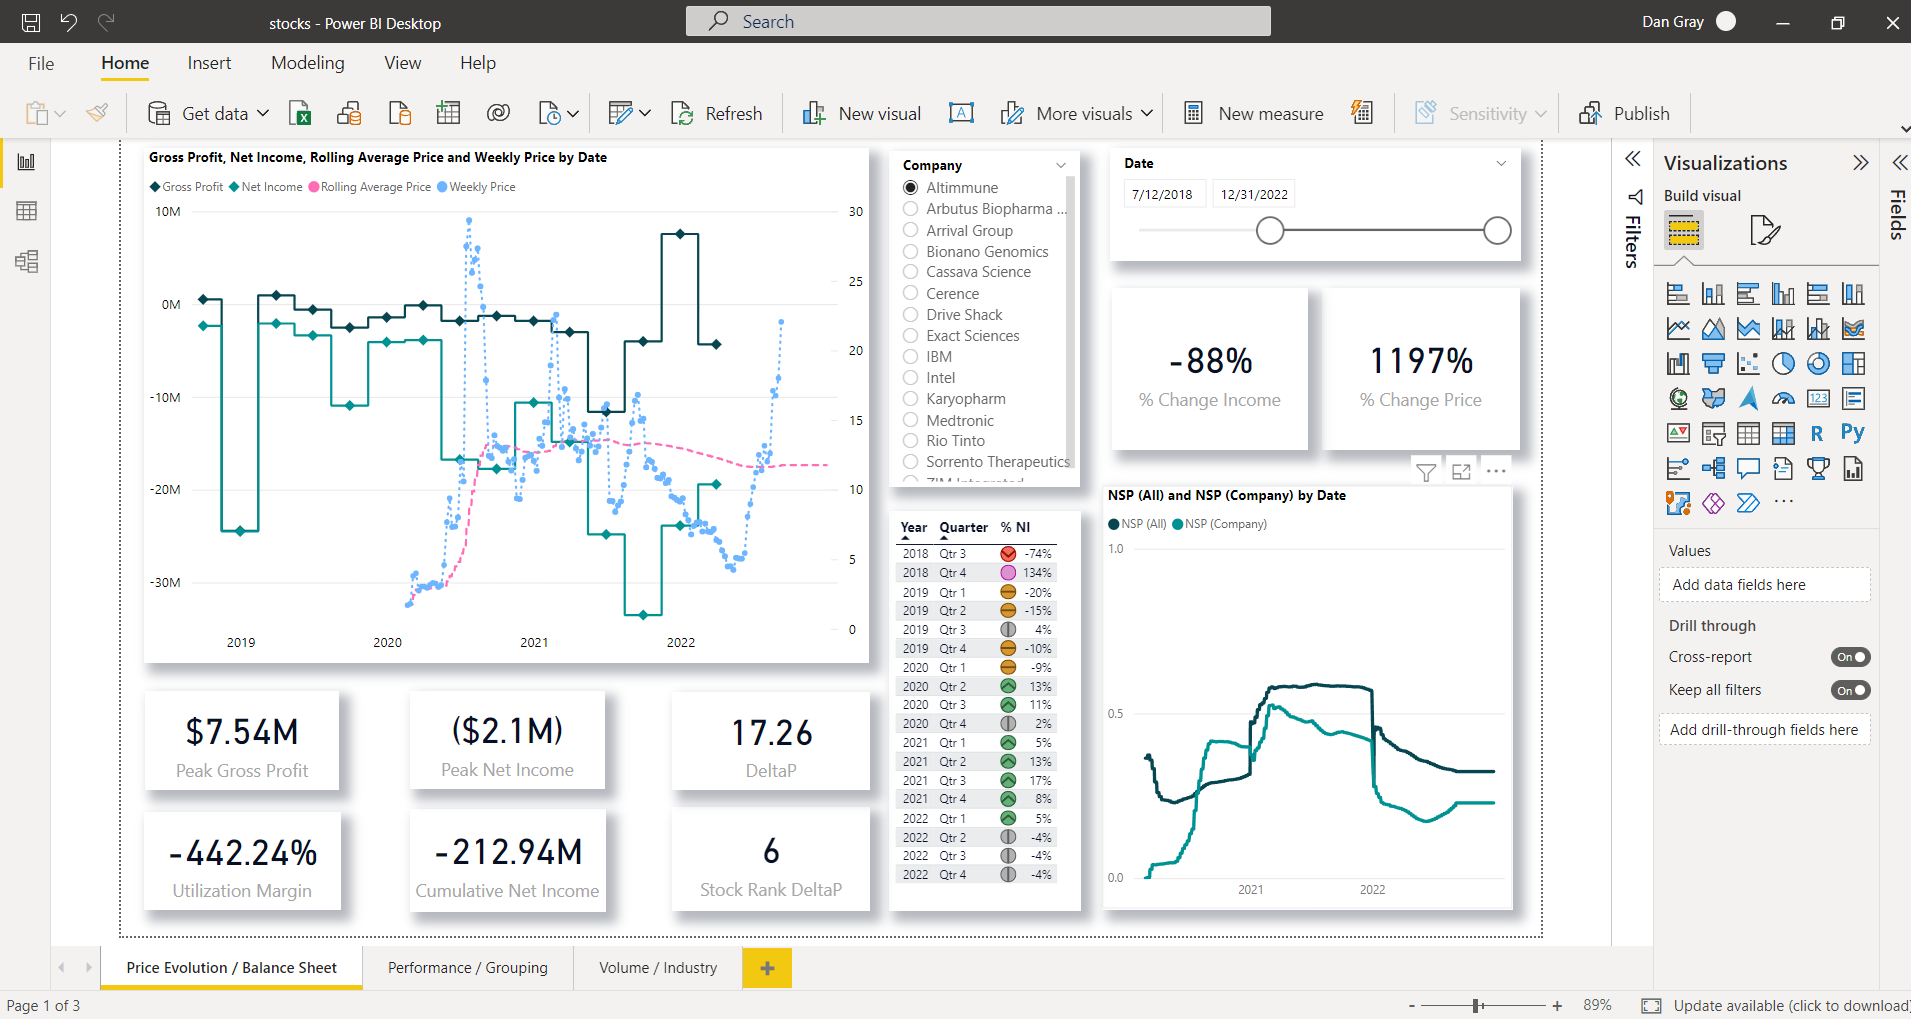
A normalized stock price (NSP) is used to compare company-specific performance to the overall performance of all the entire portfolio, i.e. all companies.
Two chained sets of measures are used, and the normalized price;
NSP Company/All <- Mean Stock Price <- Normalized Stock Price
# NSP (Company)
YTD MSP (COMPANY) =
    TOTALYTD(cr841_companyFiling[Mean Stock Price (COMPANY)],CalAuto[Date]
    )

# NSP (All)
YTD MSP (ALL) =
  CALCULATE(TOTALYTD(cr841_companyFiling[Mean Stock Price (ALL)],CalAuto[Date]),
            REMOVEFILTERS(cr841_prospect)
  )

# Mean Stock Price (Company)
Mean Stock Price (COMPANY) =
  AVERAGE(cr841_tsPrice[Normalized Price])

# Mean Stock Price (All)
Mean Stock Price (ALL) =
    CALCULATE(AVERAGE(cr841_tsPrice[Normalized Price]),
    REMOVEFILTERS(cr841_prospect)

# Normalized Price
Normalized Price =
  VAR MinOfGroup = CALCULATE(MIN(cr841_tsPrice[cr841_wprice]),
                             ALLEXCEPT(cr841_tsPrice,cr841_tsPrice[cr841_symbol]))
  VAR MaxOfGroup = CALCULATE(MAX(cr841_tsPrice[cr841_wprice]),
                             ALLEXCEPT(cr841_tsPrice,cr841_tsPrice[cr841_symbol]))
  VAR DetailValue = cr841_tsPrice[cr841_wprice]
RETURN DIVIDE(DetailValue - MinOfGroup,MaxOfGroup - MinOfGroup,0))
Performance / Grouping
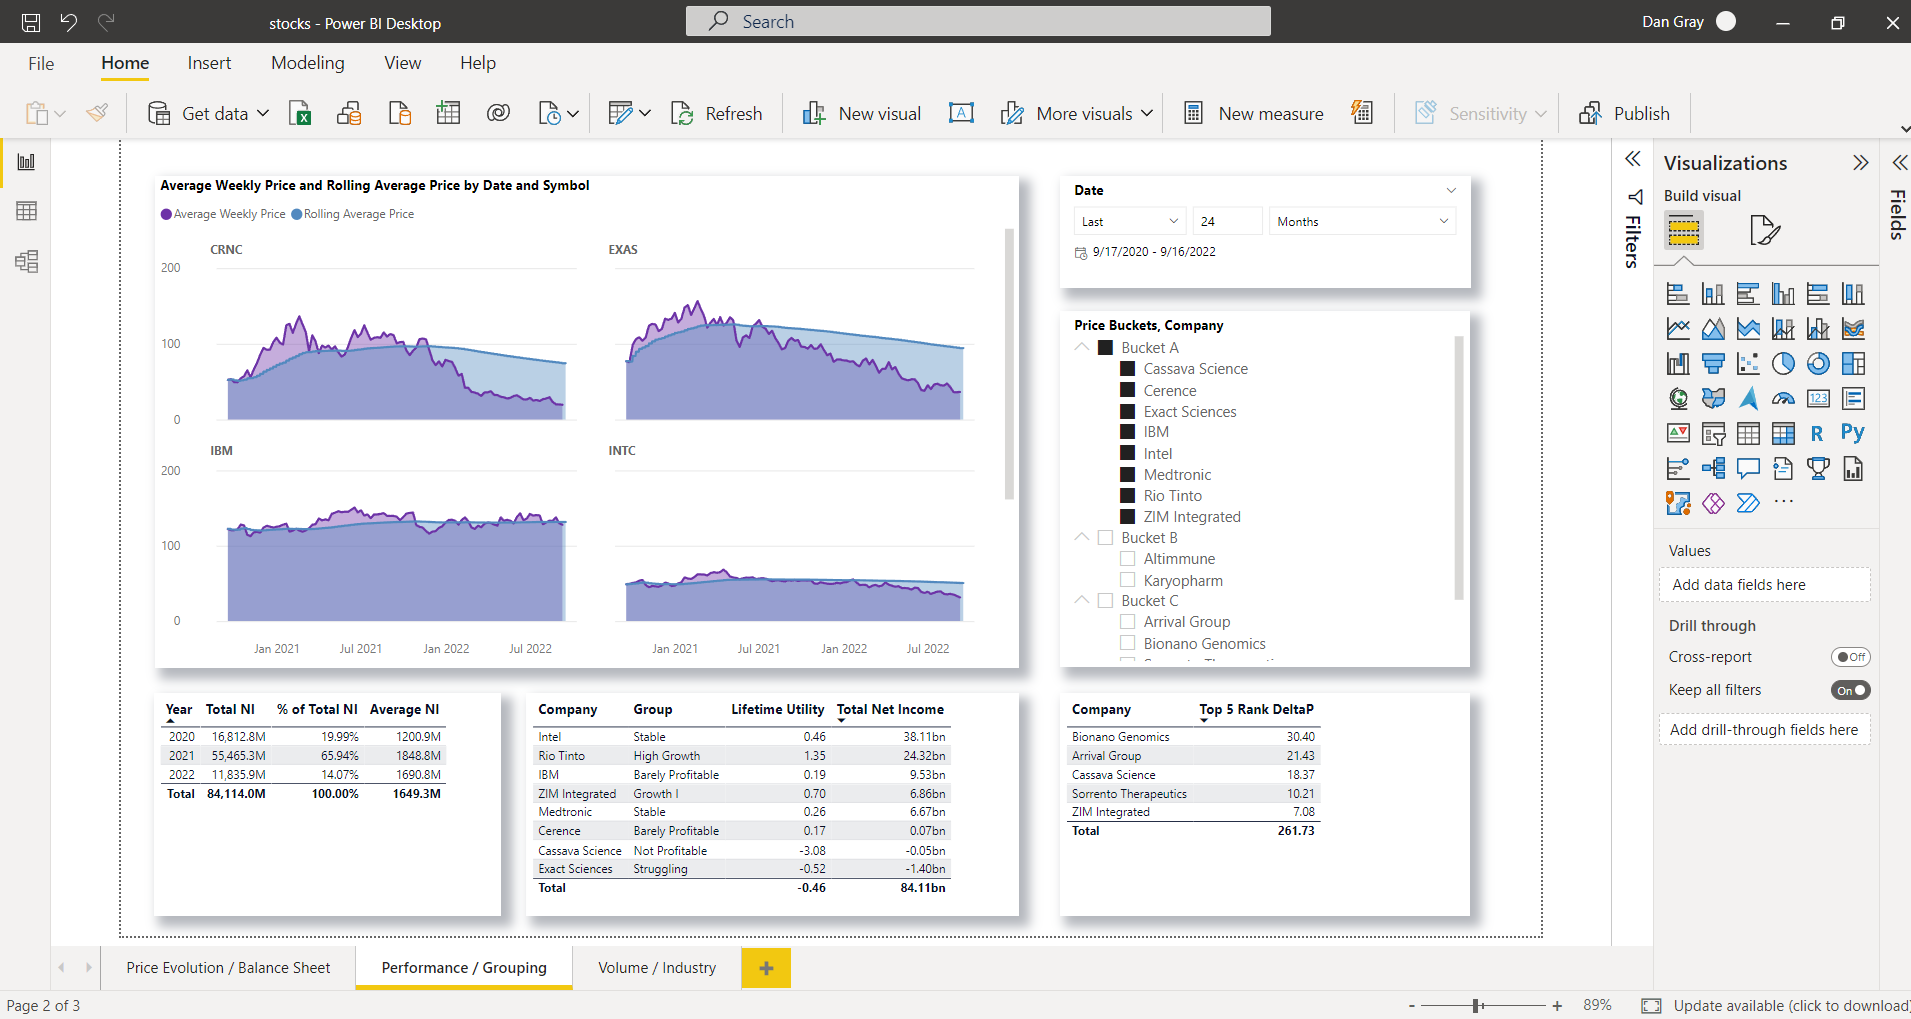 Page 2 of the report delves into comparing stocks within groups, established via Price Buckets and a so-called Utility Group.
The Utility Group is a helper table defining the ranges which group like companies, defined by a lower and upper bound as well as the group-name;
- Not Profitable, Struggling, Barely Profitable etc.
Lifetime Utility calculates the ratio of Lifetime Income to Lifetime Profit.
Utility =

IF(cr841_prospect[Lifetime Income]<0 && cr841_prospect[Lifetime Profit] <0,
DIVIDE(cr841_prospect[Lifetime Income],cr841_prospect[Lifetime Profit],0)*-1,
DIVIDE(cr841_prospect[Lifetime Income],cr841_prospect[Lifetime Profit],0)
)
If Utility was a measure instead of a calculated column Utility Group thresholds MinR, and MaxR would not only calculate the Utility Total Net Income but dynamically assign the group as the Utility shifted through the range of values.
Utility Total Net Income =
CALCULATE([Total Net Income],
    FILTER(VALUES(cr841_prospect[Utility]),
    COUNTROWS(
        FILTER('Utility Group',
            cr841_prospect[Utility] >= MIN('Utility Group'[MinR]) &&
            cr841_prospect[Utility] < MAX('Utility Group'[MaxR])
            )) >0
    )
)
Volume / Industry
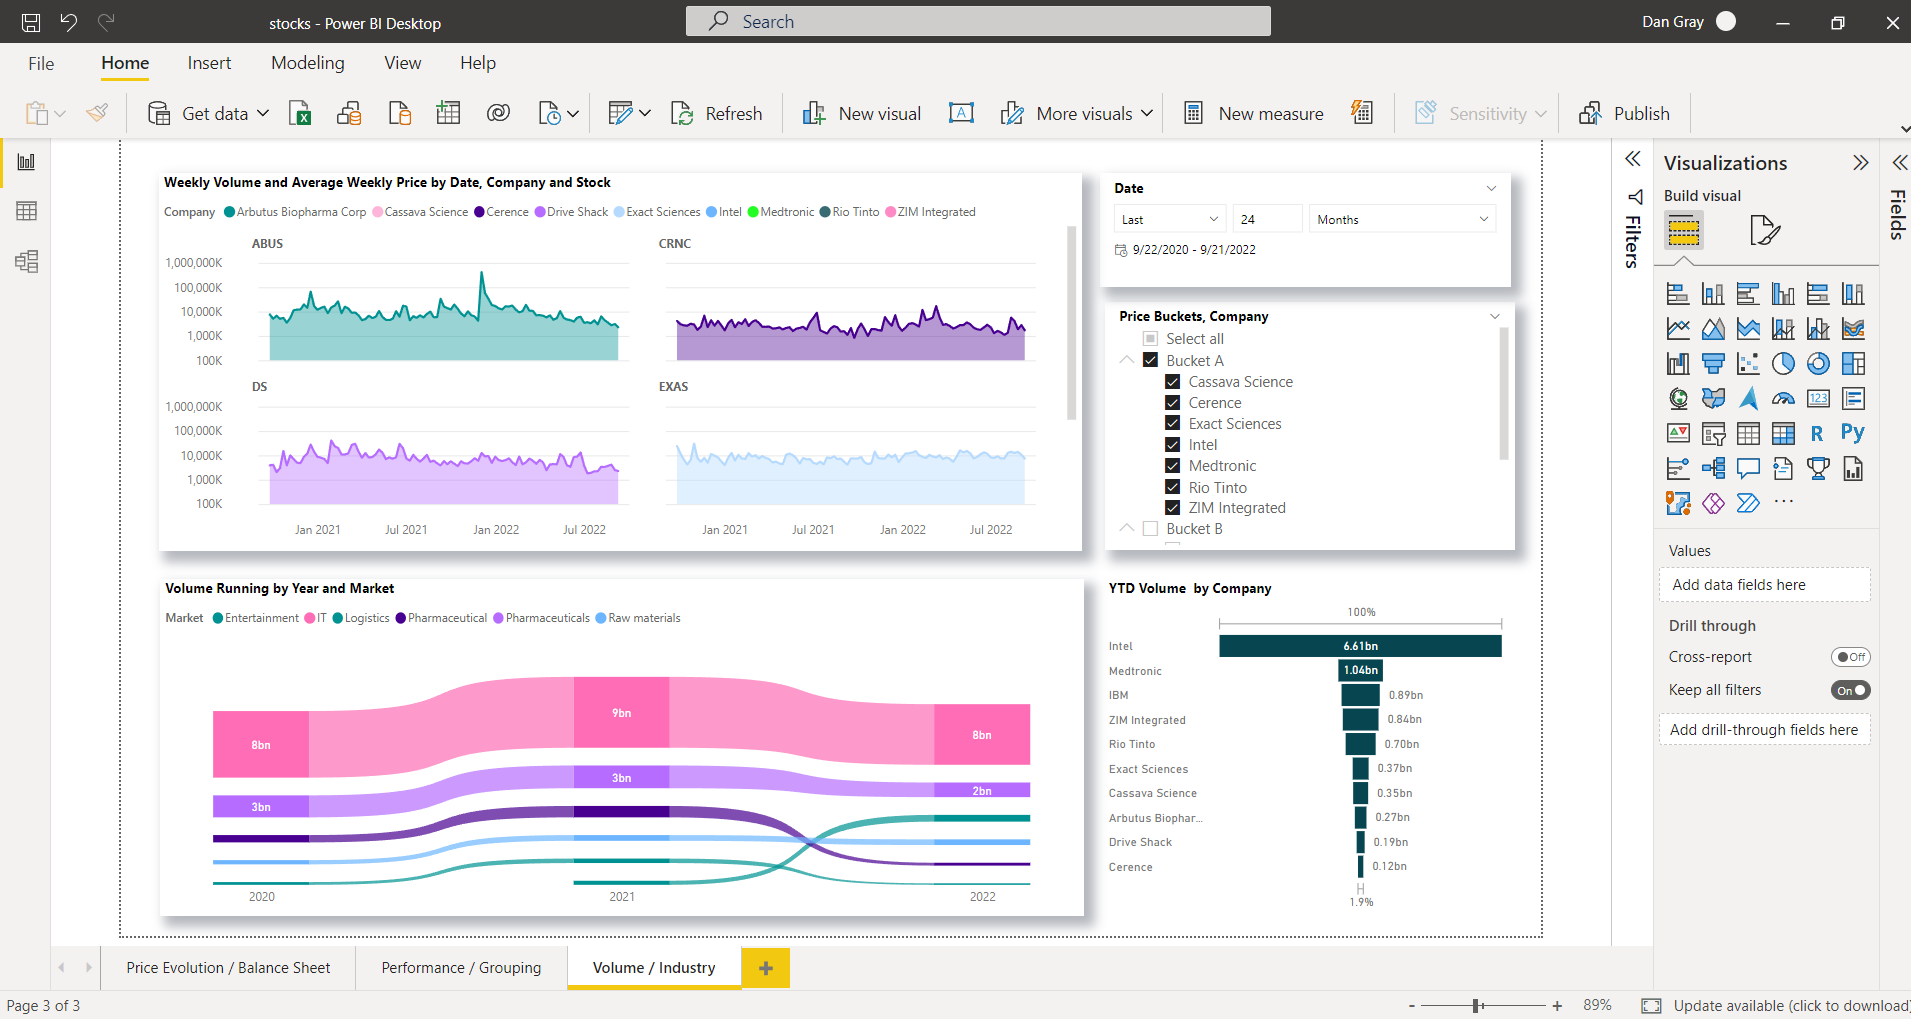
On Page 3, the Weekly Volume and YTD Volume are visualized in various forms. I use Price Buckets again to group stocks per default, but one can slice by Market too.
These primary visual serves as a quick way to notice sudden surges or drops in volume traded (retrospectively) and would be the basis for further dedicated research over the periods of interest.